Cash versus investing, and the real impact of inflation

Brad Holland
17 August 20236 min

We all know that investing involves taking more risk than leaving cash on deposit in a savings account with a bank or other financial institution. However, depositors need to be aware of three hidden risks.
The three hidden risks of cash
The first is inflation risk, which undermines the purchasing power of cash deposits as they are unlikely to keep up with the aggregate rate of price rises.
As discussed in our recent article around ‘greedflation’, the rate of increase in the headline UK Consumer Prices Index (CPI) inflation has begun to fall. In the 12 months to July it the data came in at 6.8%, down from 7.9% in June and 8.7% in May, though this still easily exceeds the Bank of England’s stated inflation target of 2%.
The second risk is bank default. While bank failure in the UK remains unlikely, it nevertheless could happen – as those who queued outside of Northern Rock during a run on the bank in 2007 feared.
If a failure were to occur, the Financial Services Compensation Scheme offers a compensation limit of up to £85,000 on all cash deposits in regulated bank and building societies (£170,000 for joint accounts). However, there are no guarantees for any deposits over these limits against bank insolvency – in investment terms, this would be called ‘default risk’.
The third risk is a timing risk. Many of us put our savings away for longer periods of time – perhaps one, two, or five years – in exchange for higher rates of return from banks. However, there are likely penalties should you require access to this money before then. This ‘lock-up period’ forms a type of risk the industry calls ‘liquidity risk’.
Why should I invest when cash rates are so high?
It is true that UK base interest rates are relatively high, at 5.25% as of August 2023, compared to more than a decade of historically low rates which came following the global financial crisis that began in 2008. The Bank of England’s rate fell below 1% to 0.5% in March 2009, and didn’t reach 1% again until May 2022.
Chart 1 shows the Bank of England’s rate has moved from near zero to over 5% inside two years. However, the chart also shows that this rate is not yet available to instant access depositors. Banks are not passing on the higher cost of money to their savings customers.
Chart 1 also shows that official cash rates go down as well as up. And so, a proper comparison between saving and investing requires a longer-term view. How long? Well, that depends on your time horizon – the period of time by which you will need to access the money.
Chart 1: BoE base rates vs average cash deposit rates (%, Jan 2000 to Jul 2023)
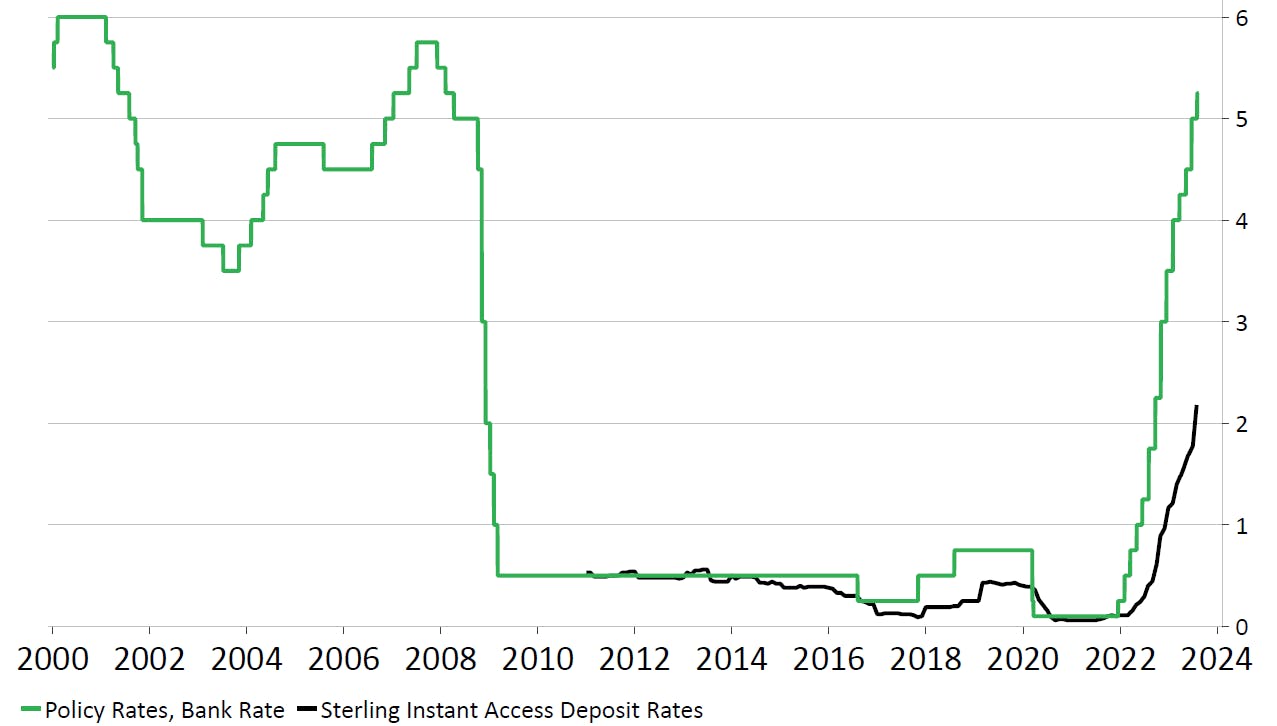
Source: Nutmeg, Macrobond
Saving versus investing
Charts 2 to 4 below provide a variety of timeframes within which to assess the relative benefits of saving versus investing, a topic which we covered in more detail in our recent article around how high interest rates may impact your finances.
The charts provide a view for individuals either saving or investing from January 2000, 2010, or 2020. Across all periods, investing has created more wealth than cash savings, though remember that past performance is not a reliable indicator of future returns.
Also, under none of the time horizons covered in these charts has savings maintained the value of the assets above inflation. In other words, in all these timeframes, the saver ended up poorer in real terms than when they started.
Chart 2 shows historical performance of a portfolio of 100% global equities alongside a mid-risk portfolio (60% in equities, 40% in bonds) versus the performance of the UK CPI of inflation and cash. For cash, we are using the Bank of England base rate – however, as we know, the real return for savers is likely to be lower than this.
While Nutmeg portfolios have only existed for the past 10 years, we can extrapolate the data looking at the historical performance of these asset classes. Note, this does not include fees.
Chart 2: Risk portfolios 6 and 10 versus cash and inflation (Jan 2000 to Jul 2023)
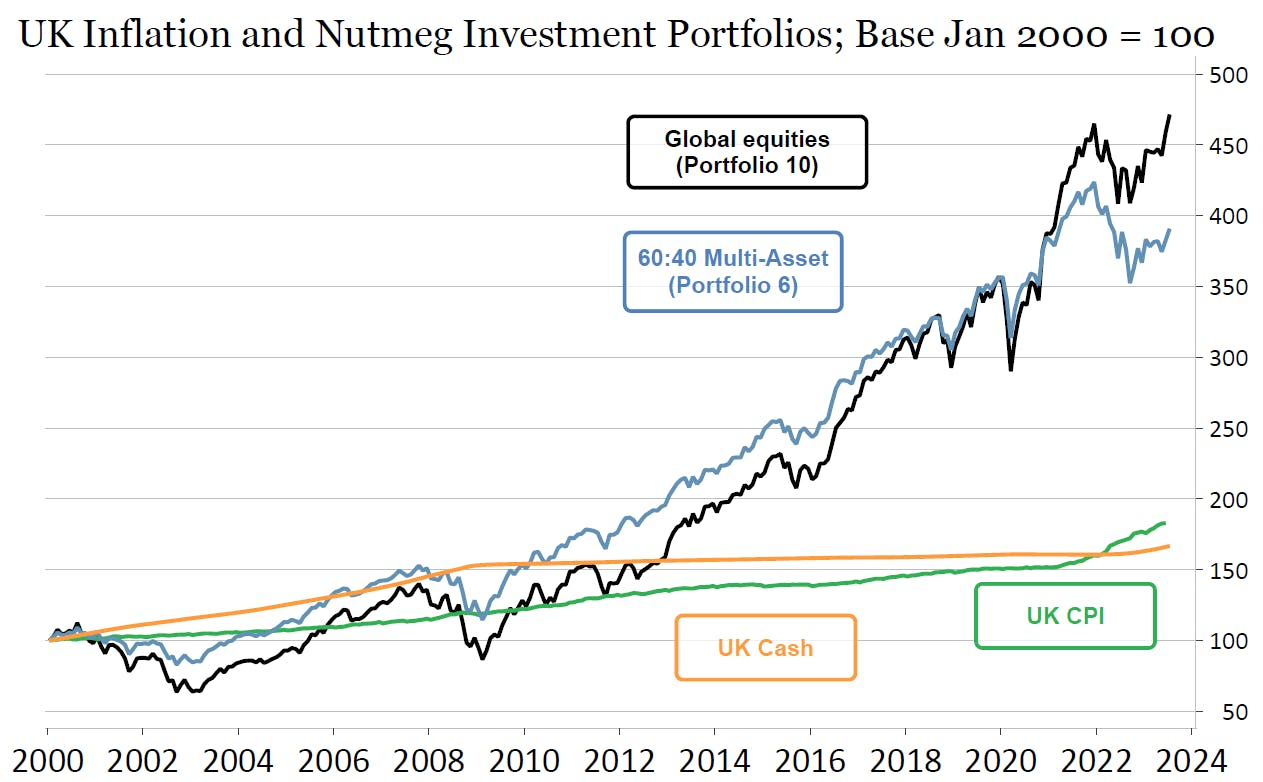
Source: Nutmeg, Macrobond, UK cash = ICE BofAML, British Pound Bid Rate Average Index (Local Currency), 1 Month, Total Return, GBP
Chart 3 covers a shorter time frame, assuming a person put in money in January 2010 and left untouched until today.
Chart 3: Risk portfolios 6 and 10 versus cash and inflation (Jan 2010 to Jul 2023)
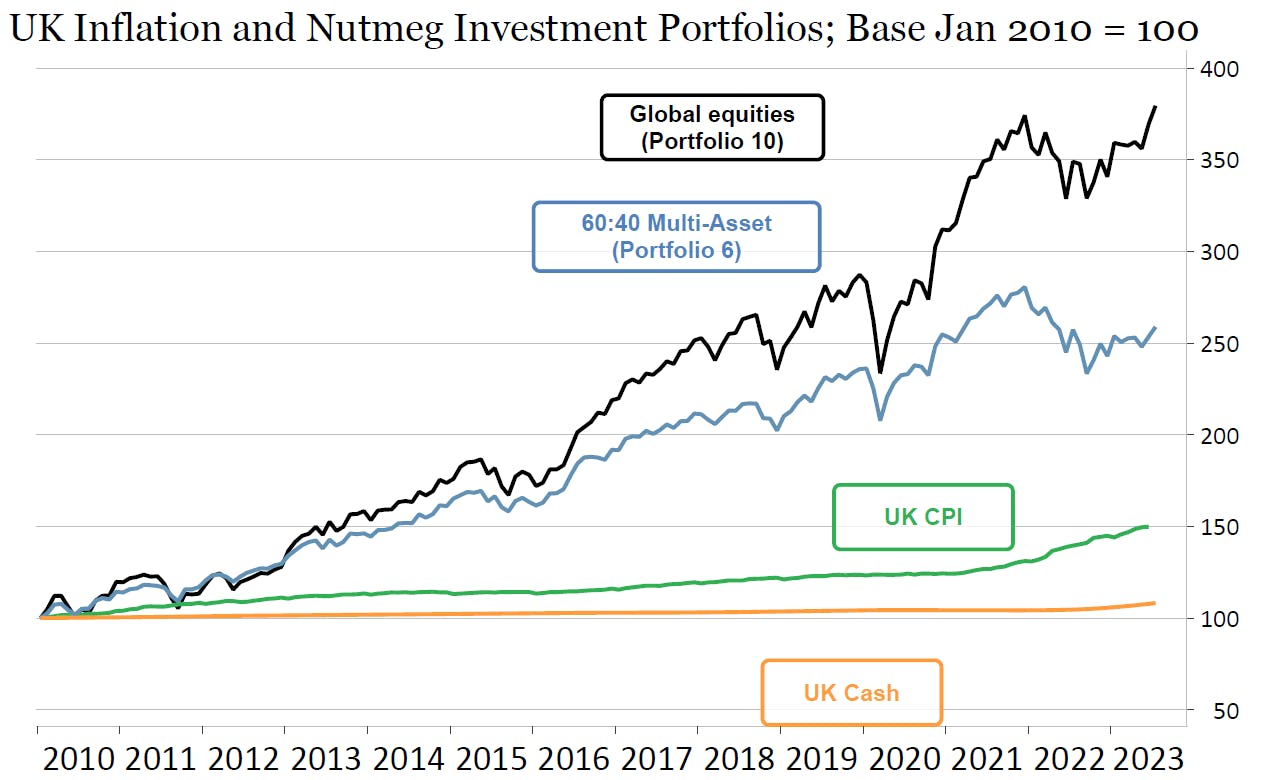
Source: Nutmeg, Macrobond, UK cash = ICE BofAML, British Pound Bid Rate Average Index (Local Currency), 1 Month, Total Return, GBP
Cash deposits at the average Bank of England rate (which as noted earlier is an optimistic assumption) would have adding a total of 8% to the assets in these 13 years to July 2023. However, the cost of living as measured by UK CPI rose 50% (from and index value of 100 to 150 in Chart 3), so a significant reduction (42% = 50%-8%) in purchasing power has occurred.
This is compared with an investment of the same amount of capital in a 60:40 multi-asset portfolio. This increased wealth by 150% (250-100), well ahead of inflation. This 60:40 portfolio has 60% equity allocation and 40% fixed income. If the investor had taken 100% exposure to global equity markets, the addition to wealth would have been nearer 250% (350-100).
For comparison, in Chart 4 we look at a much shorter time horizon starting at January 2020. Here, unlike in the longer timeframes, we can see that the multi-asset investment has so far not kept pace with inflation. This, in our view, emphases the importance of the long-term horizon of over three years when investing, something which we discuss in more detail in our article covering our six principles of investing that everyone should know.
Chart 4: Risk portfolios 6 and 10 versus cash and inflation (Jan 2020 to Jul 2023)
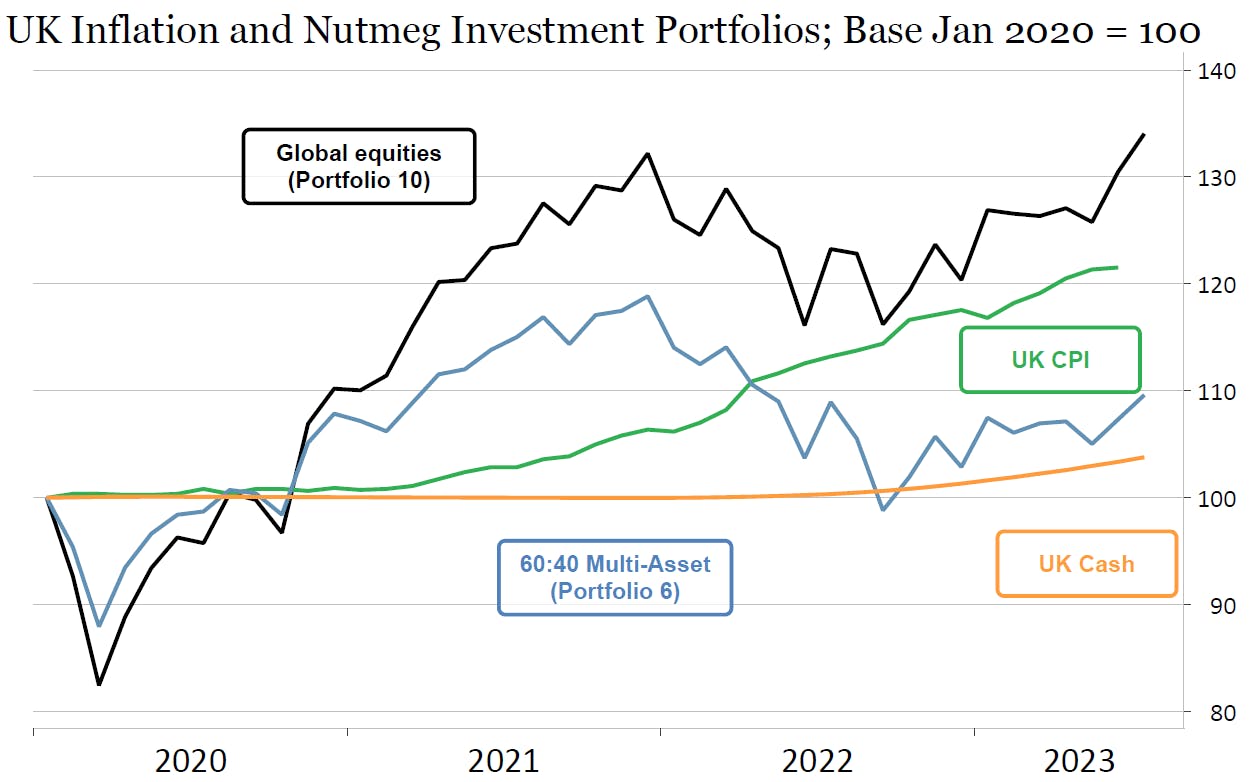
Source: Nutmeg, Macrobond, UK cash = ICE BofAML, British Pound Bid Rate Average Index (Local Currency), 1 Month, Total Return, GBP
Volatility as a natural part of investing
A decline in the value of investments can feel painful at the time, but volatility is a natural part of investing. In the longer term, higher volatility can be associated with higher average returns, and it is this higher return that can lead to wealth creation above and beyond inflation.
That’s not to undermine the importance of cash savings as part of a financial plan, despite the eroding effects of inflation. Savings are especially important for money required in the near term. Check out our seven tips for taking control of your finances for more information on keeping your finances in check.
However, for money that is not required in the near to medium term (of at least three years), investing could be a viable option. An old investment adage applies here: Higher risk can lead to higher returns. And no risk will lead to no returns.
Risk warning
As with all investing, your capital is at risk. The value of your portfolio with Nutmeg can go down as well as up and you may get back less than you invest. Simulated past performance is not a reliable indicator of future performance.