Why global policy makers have shifted to reverse gear on stimulus

Brad Holland
7 min

It’s been a long journey, but governments in the developed world are beginning to withdraw policy stimulus. So, what has this journey looked like and what should you, the investor, expect next?
Chart 1 shows where the many years of policy stimulus began. The 2008 Global Financial Crisis (GFC) caused a major melt-down in equity indices caused by collapsing confidence in the banking system. By comparison, the 2020 Covid-related crisis looks mild, despite how harsh it felt at the time. As you can see from the chart, there have been no shortage of crises outside these two episodes, but this has not stopped the total return index from tripling over the 15 years beginning January 2007 – approximately 7.5% annual average dollar (USD) return on global equities.
Chart 1: 2020 Covid crisis was mild compared to 2008 GFC
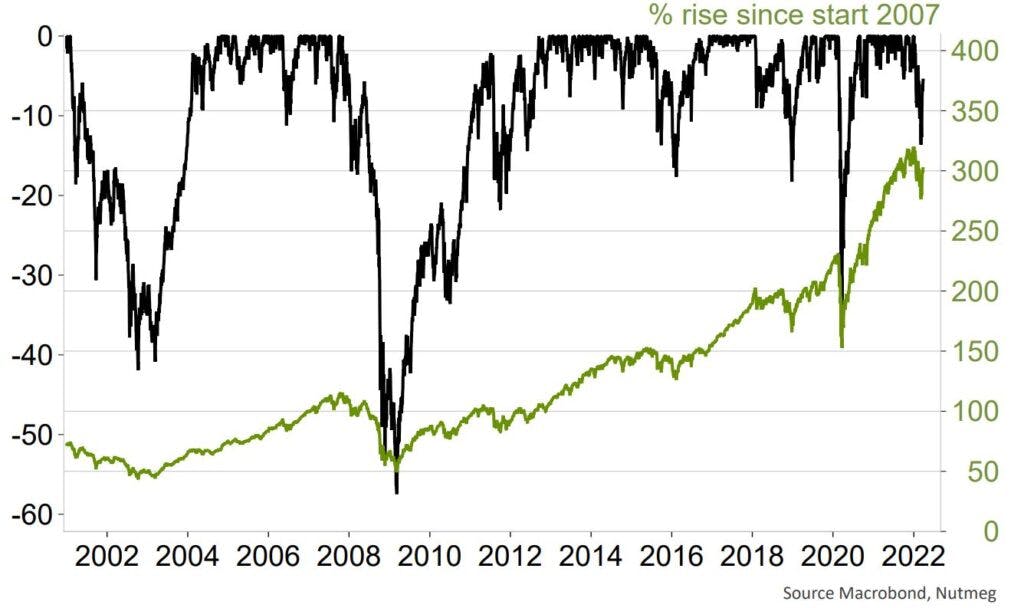
Black line = Developed economy equity index (MSCI, USD, %); drawdown from recent high-water-mark.
Green line = The same total return index (%) rebased to 100 at January 2007.
Why governments intervene
Clearly, governments do not set policy to preserve the performance of publicly traded equity indices. Their main concern is to ensure businesses and households have ongoing access to the economic and financial liquidity they require. In so doing, they maintain the level of economic activity and encourage growth.
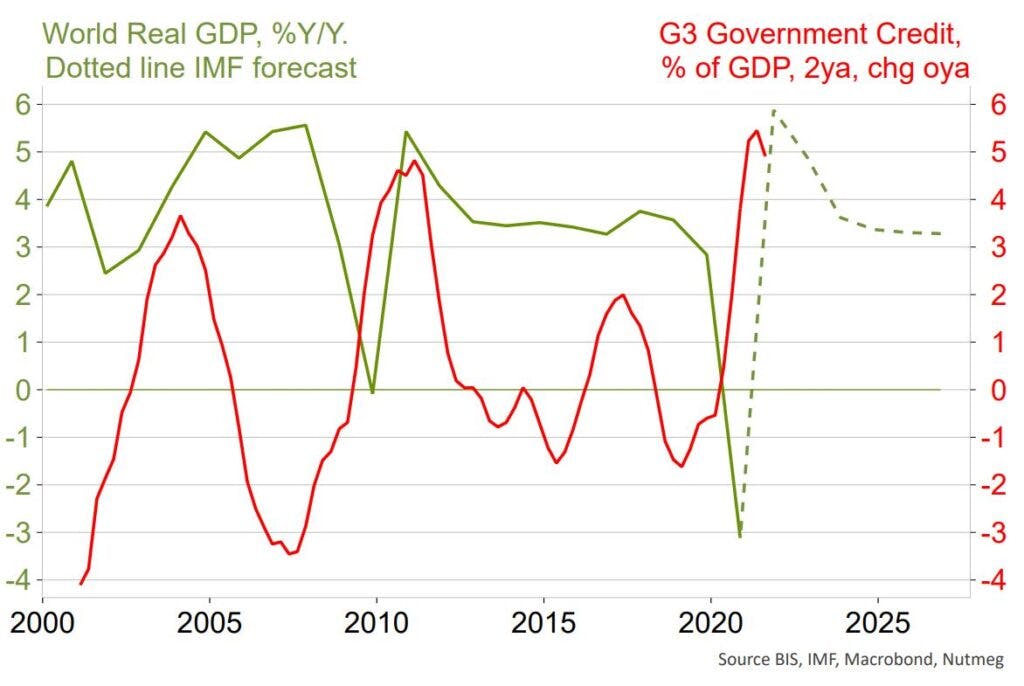
Government policy tools include both direct and indirect interventions; directly, they spend money via fiscal policy (Chart 2) and supply money via monetary policy (Charts 3-5).
Chart 2 shows that G3 governments (US, the Euro-area and Japan) spent almost 5% of world GDP to keep the economy out of recession in 2008, while they spent over 5% of world GDP in 2020 to try and offset the enforced economic shutdowns during the Covid pandemic. They didn’t succeed in preventing recession, but no doubt prevented a much worse outcome. Just as fiscal policy stimulus was withdrawn in the aftermath of 2008, so too it is now being withdrawn as the world economy stabilises.
Chart 2: Governments borrow money to fund stimulus
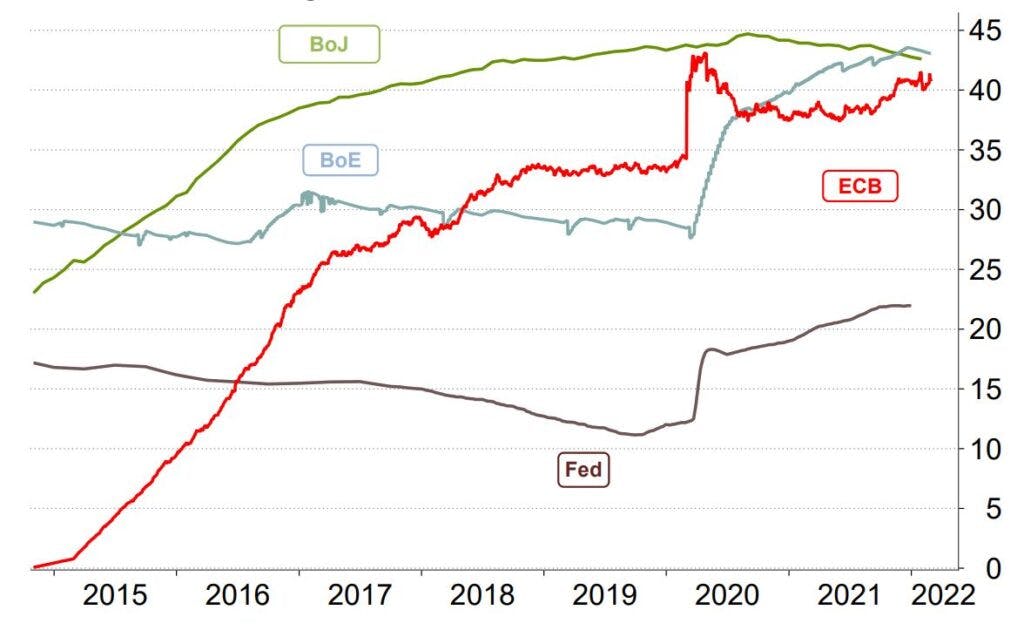
Charts 3 and 4 show that governments do not only spend money; they also have an important role in maintaining the supply of money to economies. Chart 3 shows how the big central banks have – until recently – lowered the cost of money (interest rates). This is aimed at encouraging banks to lend more and businesses and households to have greater flexibility to finance themselves. The chart shows the US began to normalise its borrowing costs in 2016 while the other countries kept rates low. The US-China trade war and the Covid crisis forced the US to change tack.
Chart 3: Central banks have collapsed the cost of capital (% interest rates)
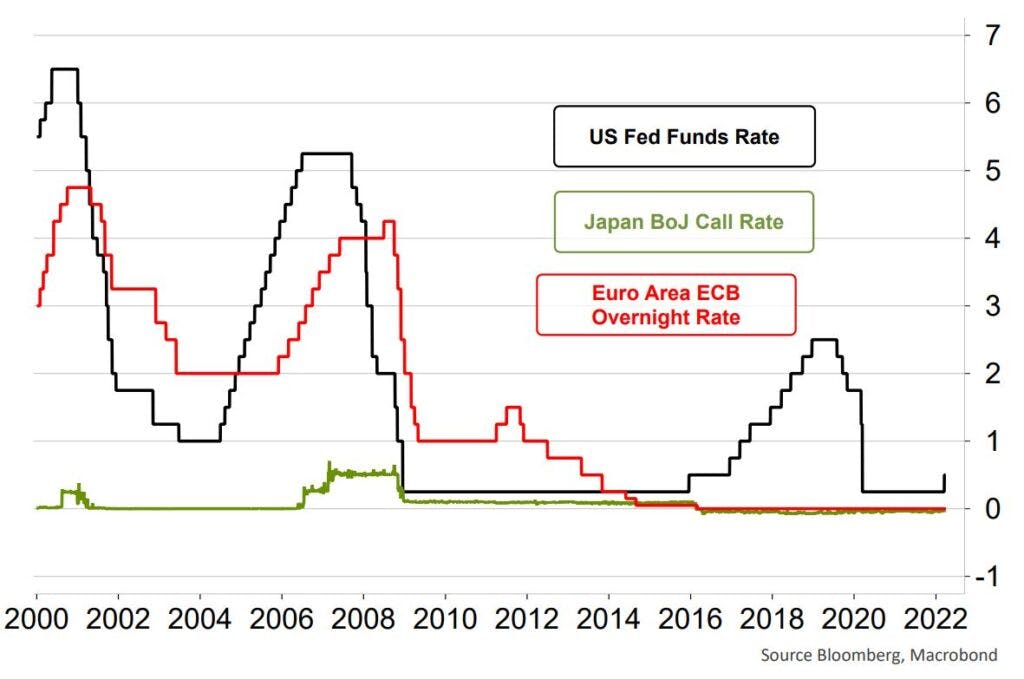
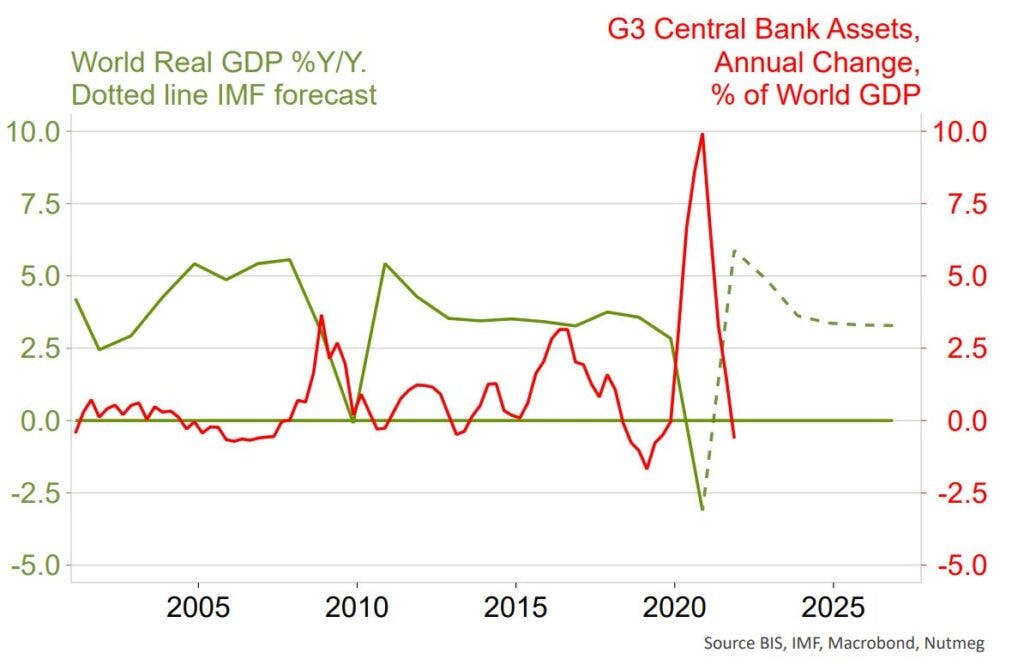
Chart 4 shows the other method in which governments supply money to their economies – the purchase of bonds. Once considered an ‘unconventional’ form of monetary policy, this ‘Quantitative Easing’ (QE) has been a key weapon in central banks’ armoury since the GFC. Immediately following the GFC, such purchases equated to 2.5% of world GDP. Then came follow-up purchases in the ensuing years as the GFC crisis reverberated through the Euro-Crisis (2010-13), Brexit (2016) and the trade war (2018-19). But the big ‘spending guns’ were brought out in 2020 with central banks buying bonds worth 10% (yes, that’s right, 10%) of global economic activity.
Chart 4: Central banks buy assets to inject liquidity and restore confidence
Why governments need now to withdraw stimulus…
Years of stimulus appear to be coming to an end in 2022. The Bank of England is unwinding its QE, while the US Federal Reserve ended its large-scale asset purchase program in March. The European Central Bank (ECB) has said it plans to bring a close to its stimulus in the third quarter of the year. So, why act now? Here’s five key reasons:
1. Inflation is rising
That amount of money clearly cannot be pumped into the world economy, year after year, without having damaging inflationary consequences. Central banks are extremely motivated to withdraw this stimulus before that inflation threat takes hold, seeing the current inflation spike brought about by supply bottlenecks as largely temporary in nature. However, they are keeping a close watch.
2. The cost of money has been low for a (very) long time
Added to this is the fact that central major central banks are looking to raise interest rates from the emergency low levels prevailing since the GFC. That process is yet to begin in Europe and Japan, but the all-important US has begun to raise rates – in tandem with the UK and Canada (Chart 3).
3. Governments own too much of their own debt
Another side-effect of pumping money into the economy is that central banks end up owning a large share of the investable stock of government bonds. Chart 5 shows this has reached over 40% in the Europe, UK and Japan. This is not a sustainable position either for governments or for proper functioning of price-discovery in these important financial securities. Central banks will not simply sell all these bonds back on the open market; that would have adverse market impact. Rather, they will manage the size of their balance sheet to gradually lower levels.
However, this means that future government budget deficits will have to be financed by the private sector rather than indirectly financed by central bank balance sheet expansion. A huge buyer is retiring from the market and that will likely have a detrimental impact on bond prices.
Chart 5: Central banks own large share of outstanding government debt, % of issuance
4. Banks are healing
As we mentioned, in 2008 the global banking system came near to collapse before government policy intervention. Chart 6 shows that bank lending to the non-financial private sector shrank as a share of world GDP in the aftermath of the GFC. Banks were not playing their necessary role in providing liquidity to economies. After a false start to recovery during 2015/16, banks again failed to grow their lending. The year 2020 saw this all change, partly due to governments providing loan guarantees to businesses as a Covid-relief measure.
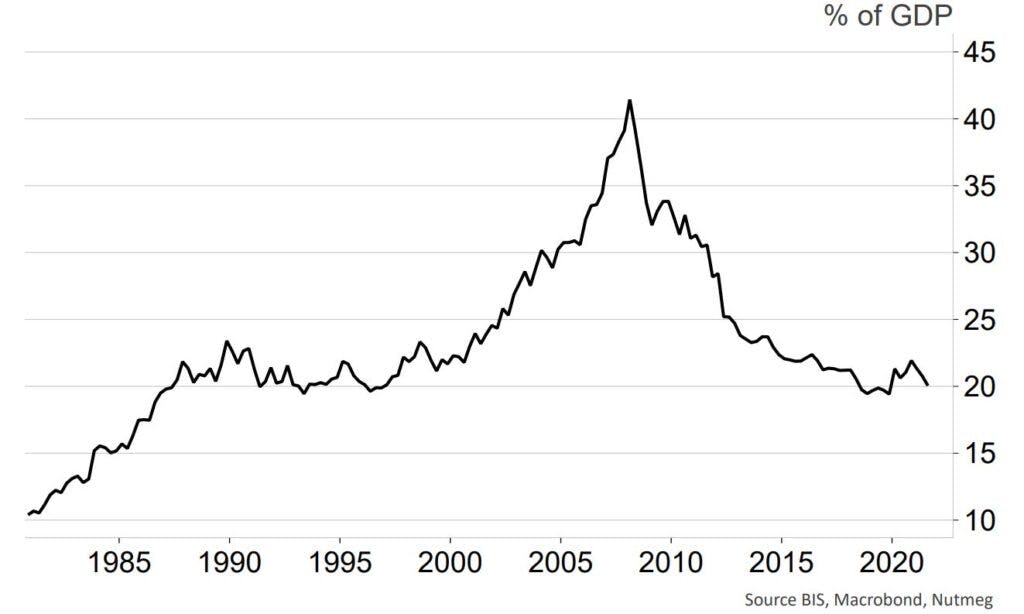
These measures will taper off in the next several years, but the banks themselves look to have largely healed from the GFC. A key indicator of this is the amount of credit banks are providing to each other. Chart 7 shows that prior to the GFC, banks were relying on foreign currency loans from other banks, measuring almost half world GDP. This unhealthy mix has now been restored to a much lower level.
Chart 6: Banks took a long time to recover from the 2008 GFC
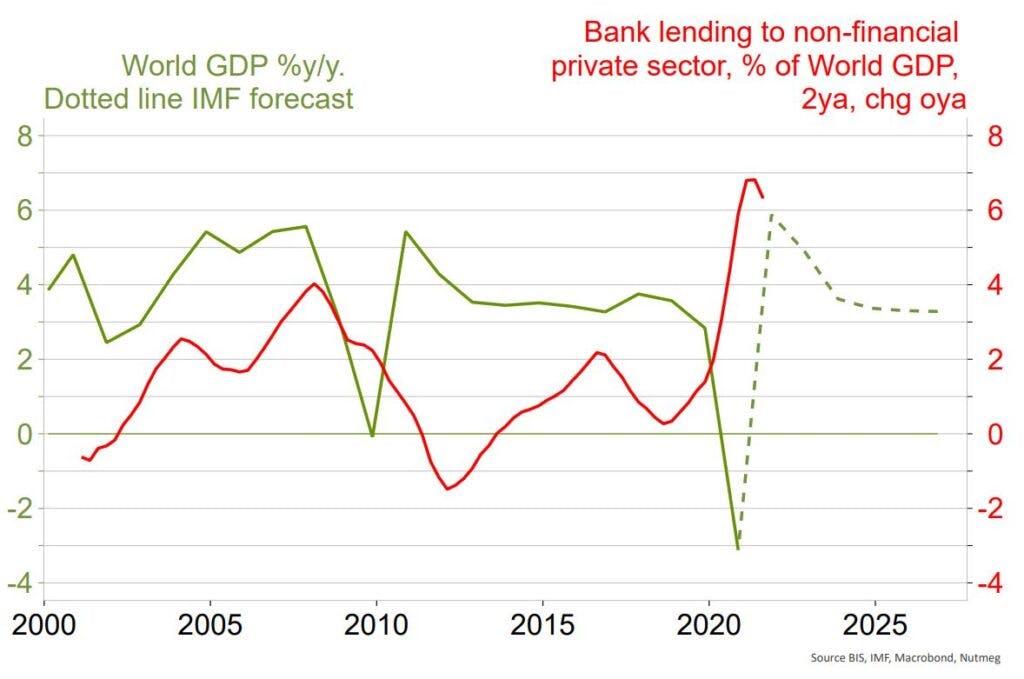
Chart 7: Banks are lending less to each other – bank-to-bank international claims
5. And the world is getting back to normal (?)
With Russia at war with its neighbour Ukraine and finding itself increasingly isolated from the West, and with the US-China axis facing increasing challenges, anyone would be forgiven for wondering ‘what is normal?’ Remember, however, that the key measure of success for government policy is that economic actors can go about their business relatively unincumbered.
Chart 8 shows that GDP volumes (the size of spending and production in an economy after accounting for impact of inflation) have recovered back above or near pre-Covid crisis levels. That’s one major measure of success for individual country government policy.
Chart 8: Economies have largely recovered from latest Covid shock – GDP
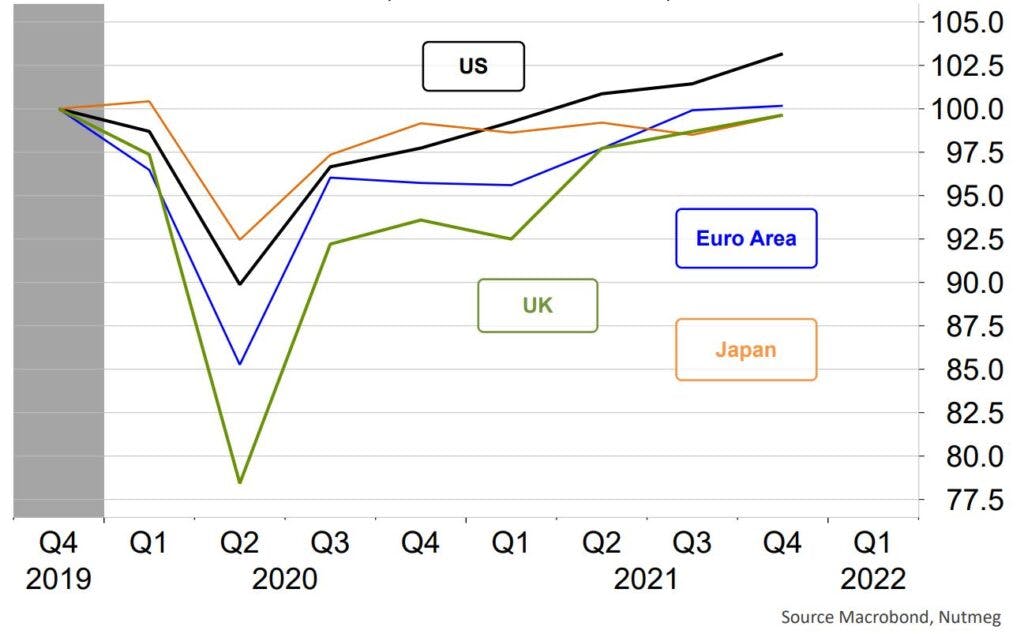
Constant prices index, Dec 2019 = 100
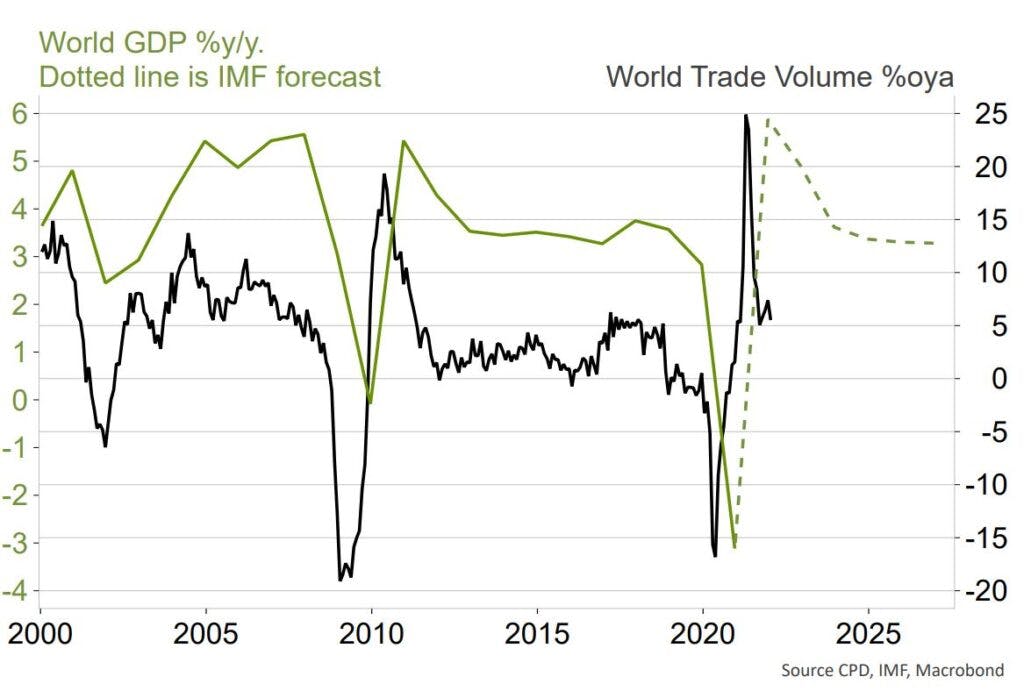
On a global level, Chart 9 shows trade volume growth remains strong after the seismic shift caused by Covid-shutdown and reopening. The world GDP growth (green line) shows how harsh the shutdown was on activity. The recession was worse than the GFC even though equity markets did not suffer as much (Chart 1).
Chart 9: Global trade took a hammering in 2008 and 2020
What does this mean for Nutmeg portfolios?
Risk is indeed the norm in financial markets, and geopolitical risks bare watching closely. However, from the perspective of government policy, it does seem the global economy was doing well before the Russian invasion. Relative prices – especially real wages and commodities – had already been shocked by the Covid crisis and now are again buffeted by the interruptions to natural resource availability.
We believe government policy will continue to manage the situation. And this means, baring a crystal ball to know President Putin’s next move, the most likely outlook is for continued economic healing with agile and creative government policy when it’s required. That points to a weak bond outlook and a reason to be positive in equities as normality is restored and pent-up business and consumer demand drives continued economic growth.
The Nutmeg investment team continues to follow the economic, political and geopolitical news flow and will adjust our managed portfolios as required.
Risk warning
As with all investing, your capital is at risk. The value of your portfolio with Nutmeg can go down as well as up and you may get back less than you invest. Past performance and forecasts are not reliable indicators of future performance.