Making sense of the UK’s economic growth puzzle

Brad Holland
8 min

It’s fair to say that chancellor Kwasi Kwarteng’s mini-budget on 23rd September, with its tax-cutting and pro-growth agenda, has not been wholly welcomed by markets. The pound hit an all-time low against the dollar (at $1.03 on Monday 26th, its lowest since Britain went decimal in 1971), while bond markets have also slumped. So, what’s caused this angst, and how does this impact our investment strategy?
Like other countries, the UK is being buffeted by energy price rises and a cost-of-living shock brought about by the Russian invasion of Ukraine. The fear has been that these price shocks will cause lower spending and investment; stalling the post-Covid economic momentum that was gathering in late 2021.
The Bank of England, along with other central banks globally, is in the process of rapid normalisation of short-term interest rate levels which – although directly targeting inflation – will indirectly weaken economic growth.
Unlike other countries, the UK has a newly installed government administration, which has come out with an aggressive tax cutting, pro-growth policy. So, where will these moving parts of the growth puzzle end up?
Are fiscal policy and monetary policy opposing each other?
The simple answer is yes. But we must remember that forces shaping fiscal policy are the 2020/21 Covid shutdown (note the 20% economic collapse in the chart), and the 2022 Russian invasion of Ukraine (note the impact that has had on inflation – the red line in the chart).
Chart 1: UK growth (GDP) versus inflation (CPI)
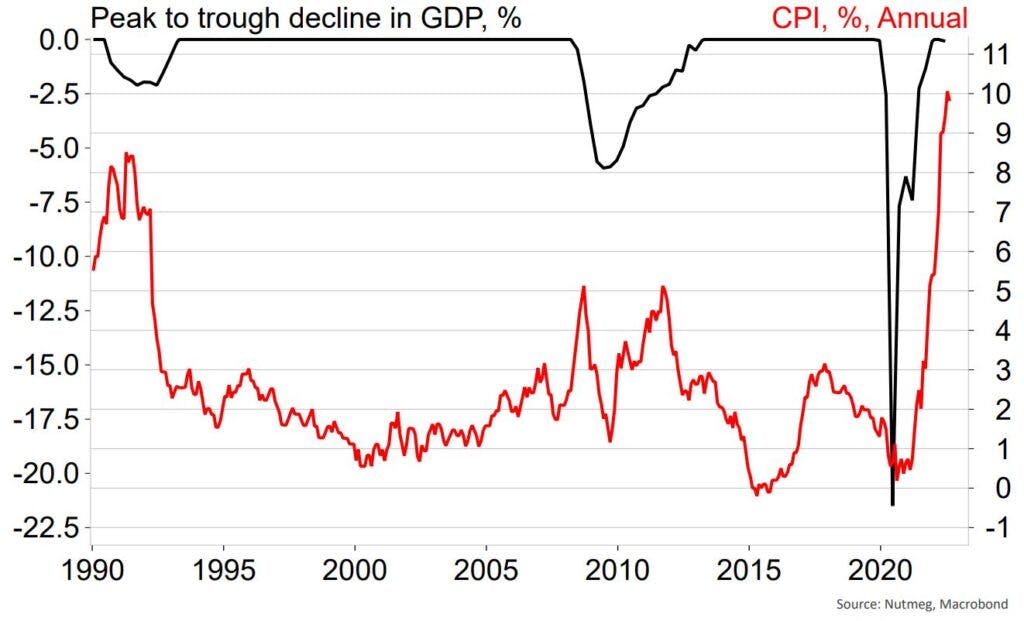
Monetary policy is designed and intended to maintain stable inflation when measured across a business cycle. Fiscal policy is best placed to respond to the external shocks to national income, prices and production we have seen in recent years. Fiscal policy can be targeted (think the furlough scheme and the recently announced energy support package) and is more immediate in its economic impact. Monetary policy has indirect effects with long-term lags, while fiscal policy of late has been custom designed to underpin the business cycle in the face of the various external shocks.
Energy policy is a game-changer for the growth outlook
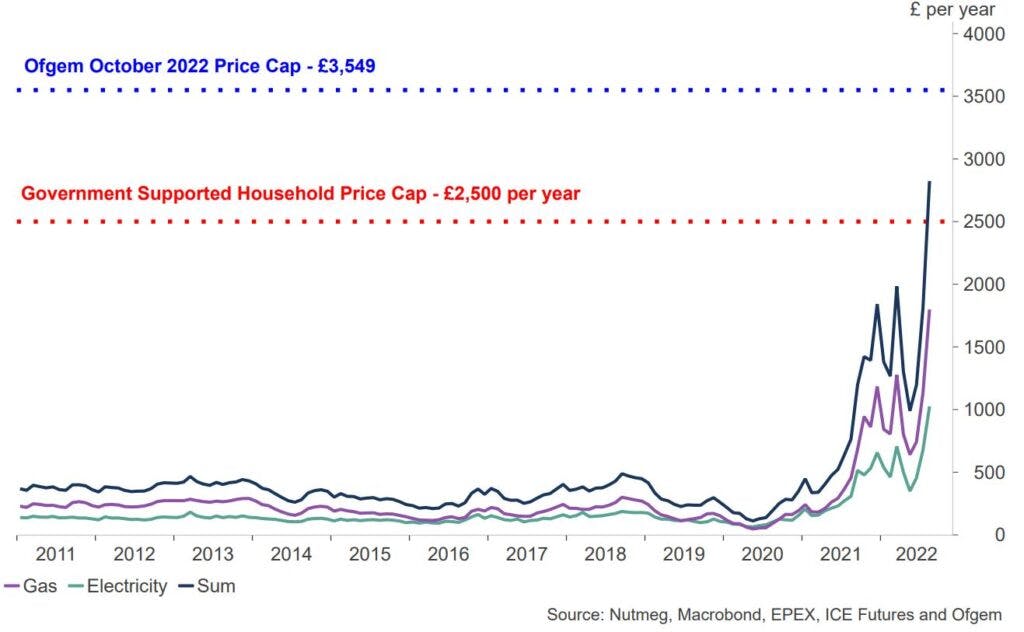
New Prime Minister Liz Truss announced on Thursday 8th September an energy support package to tackle the soaring energy costs for consumers and businesses (see Chart 2, below). Its key element being “an energy price guarantee” to limit average household energy bills to £2,500 per year for the next two years. This is welcome relief given the Ofgem standard tariffs were due to see the average UK household energy bill rise to £3,549 in October and still potentially further at the subsequent reviews.
The new measures are additional to the previously announced £400 energy bill discount/rebate. The chart first shows Nutmeg calculations of the effective energy bills of the average household and the horizontal lines show the savings made through the new fiscal support. It highlights a stark rise in costs compared to history and shows the extent of average household savings (red dotted line) compared to what was set in train for October (blue dotted line).
Chart 2: UK average annual household bill based on spot electricity and next month gas futures
Businesses, charities, and public sector employers are also to be given energy cost support over the upcoming winter months, which is set to be reviewed in six-months’ time. Other elements of the package and strategy are the temporary lifting of green levies providing another £150 per year, the lifting of restrictions of UK shale gas production, launching new oil and gas licences, facilitating the transition away from North Sea oil to renewable sources, such as nuclear energy.
“Growth budget” seeks to incentivise via cutting taxes and red tape
The new UK cabinet are seeking to boost near-term GDP growth to 2.5% (red dotted horizonal line on Chart 3). The latest July monthly GDP data shows the economy growing at around this rate. So, what is the problem? Cast your mind back to the latest Bank of England projections for the economy to shrink by 1.5% over 2023. There is a 4% growth difference between that projection and the government’s new 2.5% target!
Chart 3: UK GDP volume – annual growth (one year ago)

Importantly, the Bank of England’s projection for recession was made before the energy package was announced. The Bank, after raising its interest rate by 0.5% on 22nd September, said it will renew economic projections in November and that the energy package should be a positive benefit. Of course, the Bank was also awaiting details of tax cuts announced on 23rd September that are also aimed at boosting growth.
- The overall cost of the energy package is expected to be around £150bn, or 6% of the UK’s Gross Domestic Product, but this is highly dependent on the wholesale cost of gas and electricity over the winter months. Effectively, the government is taking on the liability for wholesale costs above the household price-ceiling. About £90bn is believed to relate to the cap on household bills, the remaining £60bn goes to support business. To provide some context, the furlough scheme during the coronavirus pandemic totalled £70bn, so this new policy takes UK fiscal policy support measures to a whole new scale. The uncertainty around the future gas price makes this an open-ended commitment of support until after the 2024 election.
- Key to the Truss-Kwarteng growth policy is the cutting of taxes and regulations. The chancellor announced a basic tax rate reduction to 19% from 20% from next April; the jettison of planned increases in National Insurance, corporate and dividends taxes; and the removal of the 45% rate for those earning more than £150k. Other measures include tax treatments for the self-employed, alcohol duties and VAT removal aimed at tourists. All told, these commitments are expected to cost £45bn spread over five years.
- Of more longer-term importance is the infrastructure and deregulation policies flagged by the Growth Plan. These include reforming the planning process to get key infrastructure and utilities built in order to achieve the net-zero 2050 target. Further areas for reform include the rural/farming economy, immigration policy and tax simplification. Exact details of these policies are expected to be announced over the coming months.
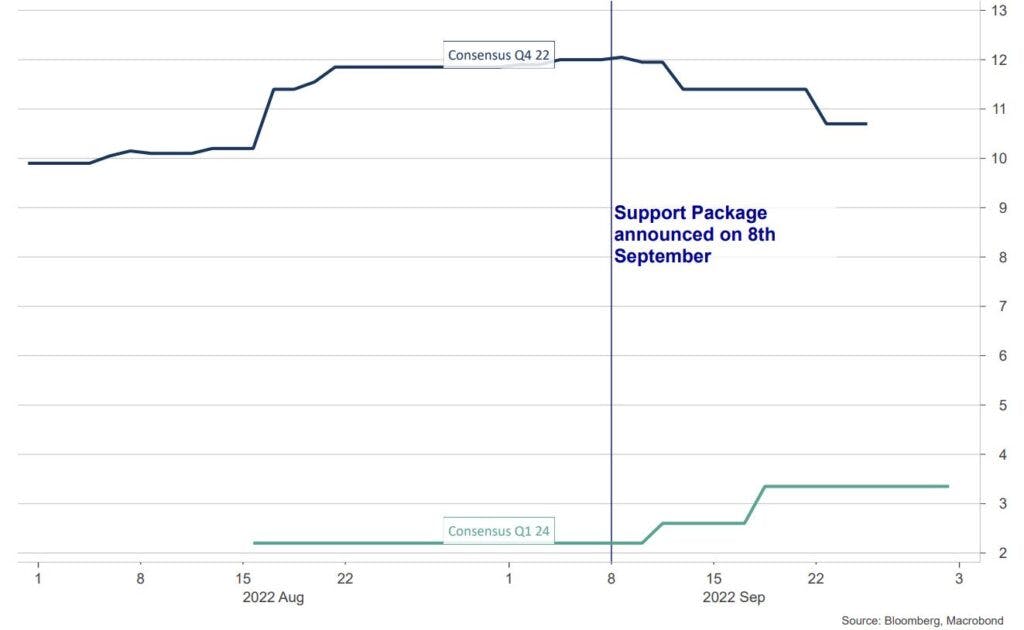
This level of fiscal expenditure will no doubt cause a headache at the Bank of England as it continues to attempt to make policy more restrictive. On one hand, the energy package will reduce the “peak” of the inflation spike in the near term, where some economists expected a 15% inflation rate post the Ofgem announcement. They are now forecasting peak inflation around 10.7% (see dark line in Chart 4) albeit with a longer tail keeping inflation above the Bank of England’s target of 2% through 2023 (green line in chart). Still though, this shows how far market forecasters expect inflation to fall by the beginning of 2024 compared to the end of 2022. It’s a dramatic deceleration in price pressure.
Chart 4: UK headline CPI year-on-year consensus forecasts
‘Paying the piper’
A critical question is how is the energy and tax cutting packages are going to be paid for? The former chancellor, Rishi Sunak, was hesitant on implementing such a plan due to concerns about fiscal discipline and the potential impact on the interest costs paid by the government. The new prime minister and chancellor are no doubt aware of this but have stated that they expect the growth benefits to cover the costs of this package.
Along with the probable rise in national debt, the cost of debt servicing is expected to rise. Since the announcements are funded by higher debt (about £72bn a year is mooted), and since the interest rate owing on that debt is now rising, there is a “double-whammy” cost hitting HMRC over the next six-to-12 months.
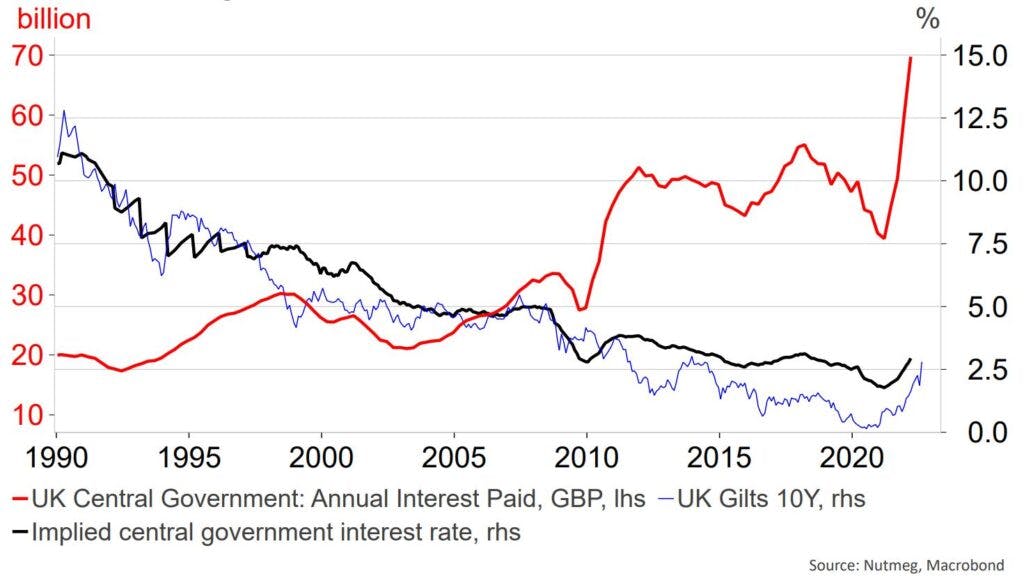
Chart 5 shows that the ‘effective interest rate’ (black line) paid by the government moves quite closely with market bond yields – which are heading up. The red line in the chart is the £-cost of servicing debt (lately £70bn per year). Government debt is over £2.4tn and looks like heading towards £2.5tn in coming years. At a 3% interest rate, that’s £75bn a year in interest payments alone (3% of GDP). This compares with the last two decades where such costs have been £50bn or lower (red line).
Chart 5: A 3% average interest rate on £2.5tn debt is £75bn debt servicing bill
These types of calculations show how reliant the government is on a rebound in economic growth. The government has committed the taxpayer to pay for these policy measures in the future, yet the very tax base required to do so has been diminished by these announced tax cuts. Since the tax share of the economy will be smaller in the future, a much bigger actual economy will be required if these policy measures are to be self-financing.
Impact on Nutmeg investment strategy
Government bond markets have responded with scepticism, with prices falling heavily since the new government was formed and immediately following new policy announcements. The bond market’s judgement seems to be that there is too much fiscal policy risk, compounding the existing monetary policy risk for bonds from rising short term interest rates.
Indeed, compared to the week prior to the budget, money markets have responded by raising the expected short rate by mid-2023 by an additional full 1%. Nutmeg shares the market’s scepticism; we have been underweight UK government bond risk for several years.
Another current trend is for a very weak pound sterling, though many other currencies are in the same situation compared to the US dollar undergoing an incredibly strong phase. The market’s mistrust of UK fiscal policy is making the pound-sterling weaker still.
Meanwhile, in the immediate term, this hasn’t materially impacted our view on the UK equity market nor the current allocation to the UK within portfolios. Although the likelihood that any future recession will be shallower – because of this energy package – adds further support to our current overweight UK position. Achieving the 2.5% mini-budget growth target could see a shift in sentiment back towards the FTSE 250 (mid-sized companies) portion of the UK market which is more domestically focused than the FTSE 100 (large companies).
Of main relevance, though, is the impact of increased government debt on gilt markets, and Nutmeg continues to hold an underweight exposure to this asset class. The investment team continues to monitor events closely and stands ready to alter portfolio allocations where appropriate.
Risk warning
As with all investing, your capital is at risk. The value of your portfolio with Nutmeg can go down as well as up and you may get back less than you invest. Past performance is not a reliable indicator of future performance.