
Recent poor bond market performance has caught many by surprise; not least because bond-based investments are expected to have low long-term volatility. Here we explain how the events of 2022 came to be and lay out a framework for suggesting where government bond yields are likely to settle.
It’s a difficult time for all investors, and we do understand the frustration and disappointment that clients may feel when looking at the recent performance of their portfolios, especially in bond-heavy low- and medium-risk portfolios.
However, we believe that the events of 2022 are very unlikely to be repeated. To get a glimpse of the future, we’ll need to take a look back to before the 2008 global financial crisis. We’ll also show that there could be a silver lining for bond investors who have suffered a loss in value of their portfolios this year.
That comes from the restored level of bond ‘yields’ which should provide much higher income than in recent years – which will contribute to overall total returns – and not dissimilar to those enjoyed in portfolios in the early 2000s.
We begin by giving a quick summary of the rationale for continuing to include bonds in balanced portfolios.
What is a government bond and what is its place in a portfolio?
Government bonds provide a fixed rate of interest (also known as coupon rate), which is paid twice in a year during the life of the bond; at the end of the bond’s life, the principal is repaid.
To put it more simply, you can think of a government bond as an IOU from the government – you lend them a sum of money, let’s say £100, and they agree to pay you a fixed level of interest on that sum, let’s say 1%, for the life of the bond, let’s say ten years. The government will pay you 50p coupon, twice per year for 10 years, and at the end of the term, they will repay you the original investment of £100.
The fixed nature of the coupon rate gives rise to the asset class’s name – ‘fixed income’. This fixed income return component of a balanced portfolio traditionally provides ballast for the more volatile returns from equity markets.
Once issued by governments, the market price of bonds fluctuates based on the general level of market yields (bond coupon divided by market bond prices). These yields move according to the conditions prevailing in the economy after the government has issued the bond.
UK government bonds – otherwise known as gilts – have historically been less volatile than equities, as we can see from Chart 1 below.
Chart 1: Gilts normally have lower volatility than equities
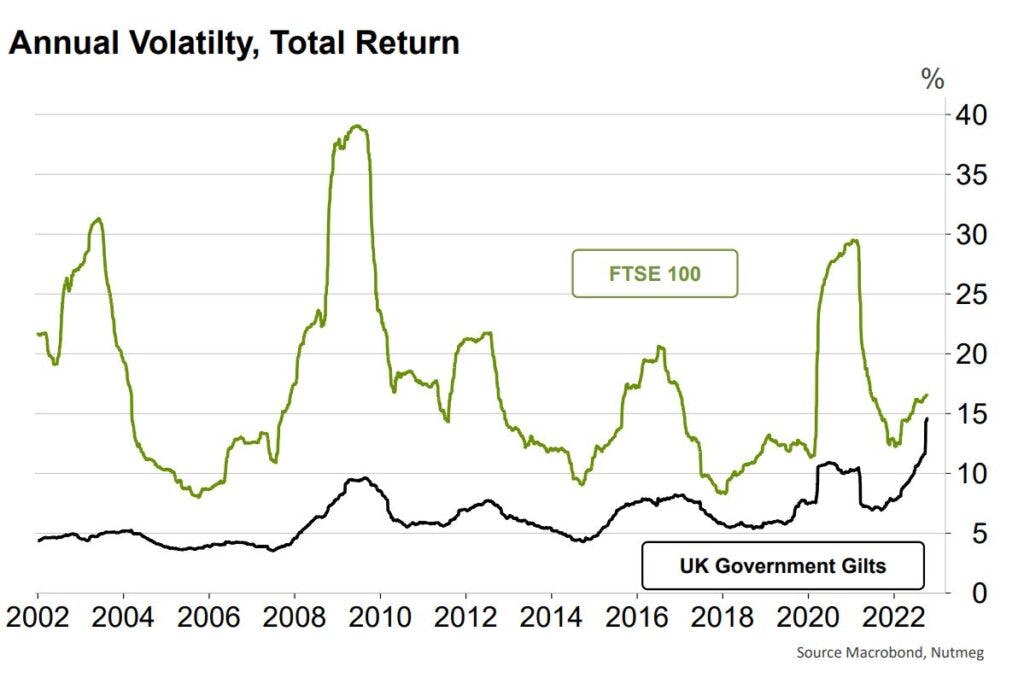
However, investors around the world have felt the force of the unusually high government bond volatility in 2022; the chart shows annual volatility near 15% which is well into the range expected from equities (as represented by the green line, the FTSE 100).
Why have bond markets lost so much value this year?
Bond valuations fall when bond yields rise (just as they rise when bond yields fall). And this inverse relationship has been giving us warning signals for several years as bond yields fell to very low levels.
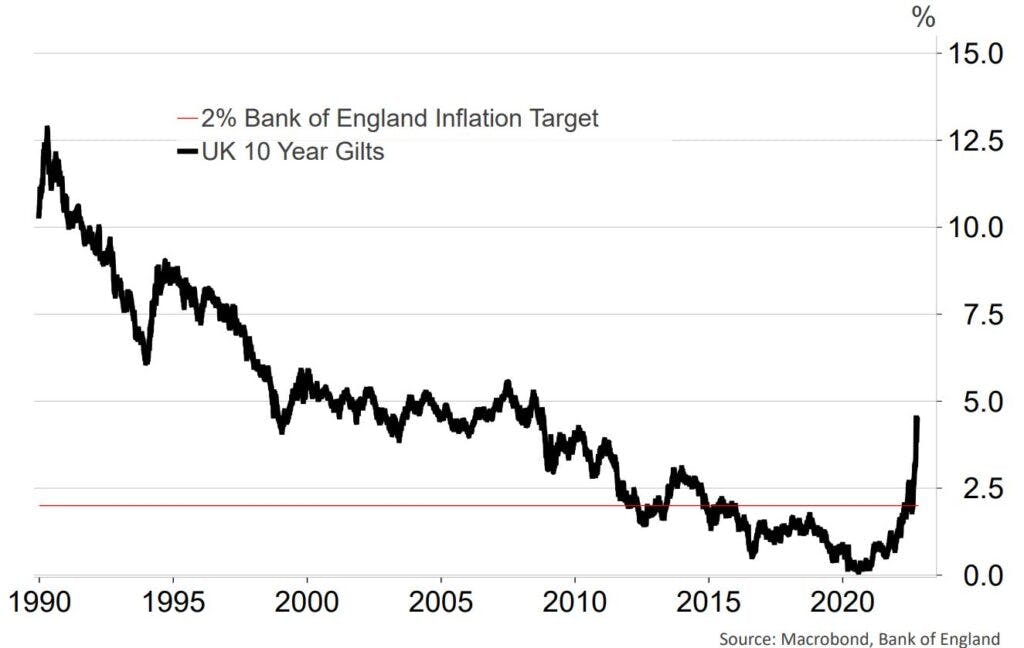
Chart 2 below shows that the 10-year UK government bond has offered a return of less than the target inflation rate (red line) since 2015. And yields almost reached 0% in 2020.
Chart 2: Gilt yields back to their pre-global financial crisis level
But bond markets seemed protected while central banks were conducting such extraordinarily easy monetary policy (see Chart 3 below).
Chart 3: Monetary policy pushes bond yields/prices to extremes
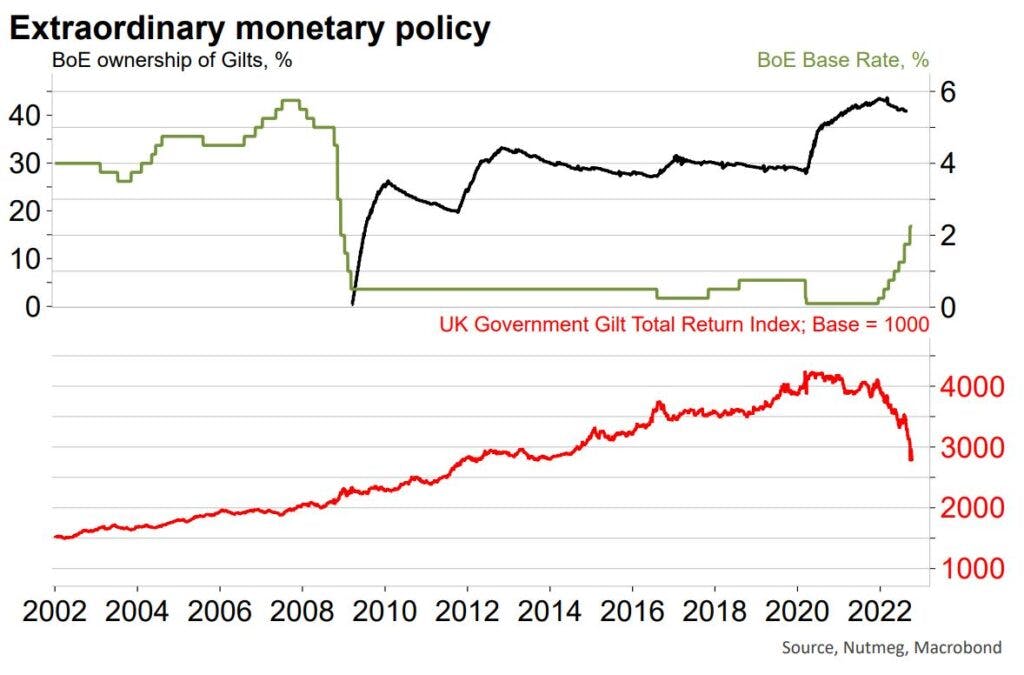
The starting point of 2022’s poor bond market performance was a base rate (the Bank of England’s official cash rate) of near 0%, which is shown as a green line in the chart.
Still, another way that the Bank of England, along with all central banks, have added liquidity to the economy is by purchasing government gilts from banks, shown by the black line in the chart. This began in the years following the 2008 global financial crisis, and by 2012 the Bank came to own around 30% of all UK government debt.
When the Covid crisis struck in 2020, more extraordinary liquidity measures were undertaken which left the Bank of England owning almost 45% of gross central UK government debt.
So, it was this massive buying spree, together with zero interest rates, that took bond yields to near 0% and, as a result, UK government gilt valuations to extreme highs, as shown by the red line in the chart.
Attack from four sides on bond valuations in 2022
The red line in Chart 3 reveals the extent of decline in the overall UK government bond market in 2022. In fact, bond investors have suffered a four-fold attack on bond valuations. First was the inflation shock that began late 2021, but really took off in 2022 after war broke out in Ukraine.
Among financial assets, government bonds are most adversely sensitive to higher inflation because their coupon rate is fixed. If inflation rises above an existing bond’s coupon rate, then the bond suffers negative real income returns. Its price falls as a result, leading to an increase in its market-yield.
The second front of attack on bond valuations came with the rapid rise in cash rates from a zero starting-point. Central banks have been playing catch-up because of the surprising speed of inflation. Bond yields need to rise (and prices fall) when cash rates rise because bonds carry higher risk than cash. Bond yields rise to prevent investors moving assets into cash to enjoy the higher rate.
Third, the Bank of England began to sell some of the gilts it has been holding since the global financial crisis of 2008. The black line in Chart 3 shows that this selling process began in 2022. It was very well signposted so came as no surprise to the bond market.
But, taken together with the jump in inflation and cash rates, this selling by the largest owner of UK government bonds did worry the rest of the market.
Fourth, UK fiscal policy is being made more accommodative by the new Conservative government, which has caused the bond market to worry about excessive UK debt levels. Higher debt creates more concern over inflation and the fiscal risks inherent in government bonds. Higher yields provide higher reward for this higher risk.
So where should bond yields end up?
It’s clear that bond yields have already risen dramatically in 2022. We have spoken about the reasons for this – which are also the reasons Nutmeg has been underweight government bond risk in its portfolios for several years – but where should we expect yields to settle in the next six to 12 months?
Chart 4 may answer this question by looking at the long-term average growth rates in the economy (green line). We can see that that this was 5% in the early 2000s but has fallen to around 4% of late. Most likely the future neutral rate of economic growth will be a bit below 4%.
Chart 4: Where will bond yields settle? The macro view…
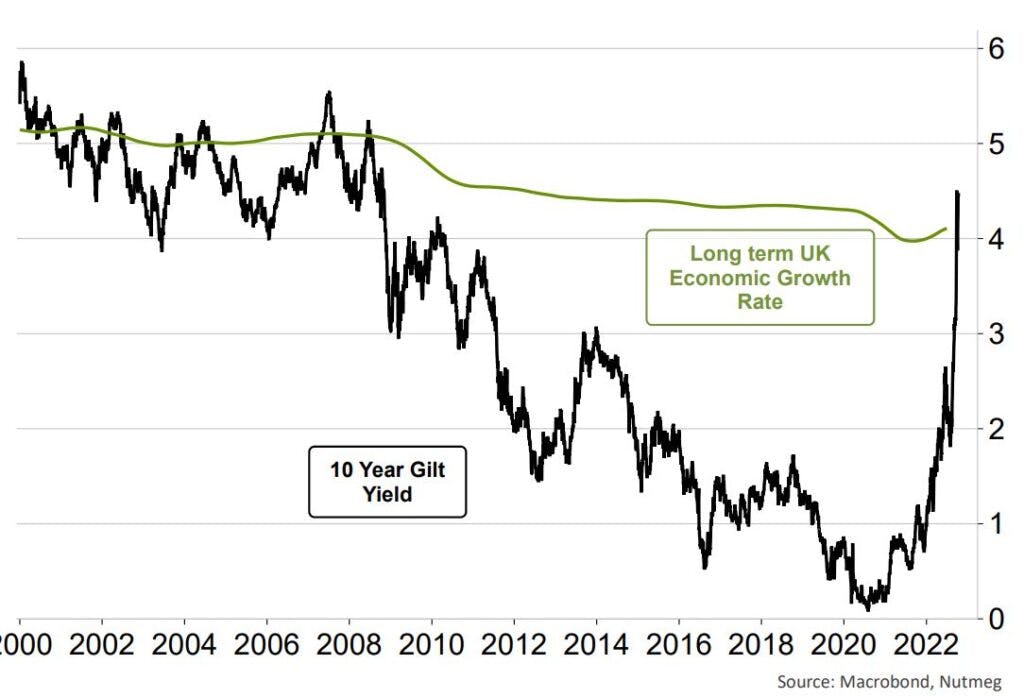
The chart also shows that prior to the 2008 global financial crisis, bond yields did revolve around this long-term average nominal UK GDP growth. Economists view this as a stable relationship for indebted countries.
It stands to reason that, after the normalisation process under way is completed, this nominal GDP growth metric should determine the long-term benchmark around which bond yields gravitate, and the chart shows most of the adjustment may have already been made. There is a further guide on where UK bond yields are heading, by looking at money market expectations for the Bank of England official cash rate. Chart 5 provides a measure of this over the next year (blue line); 5%.
Chart 5: Where will bond yields settle? The money markets view…
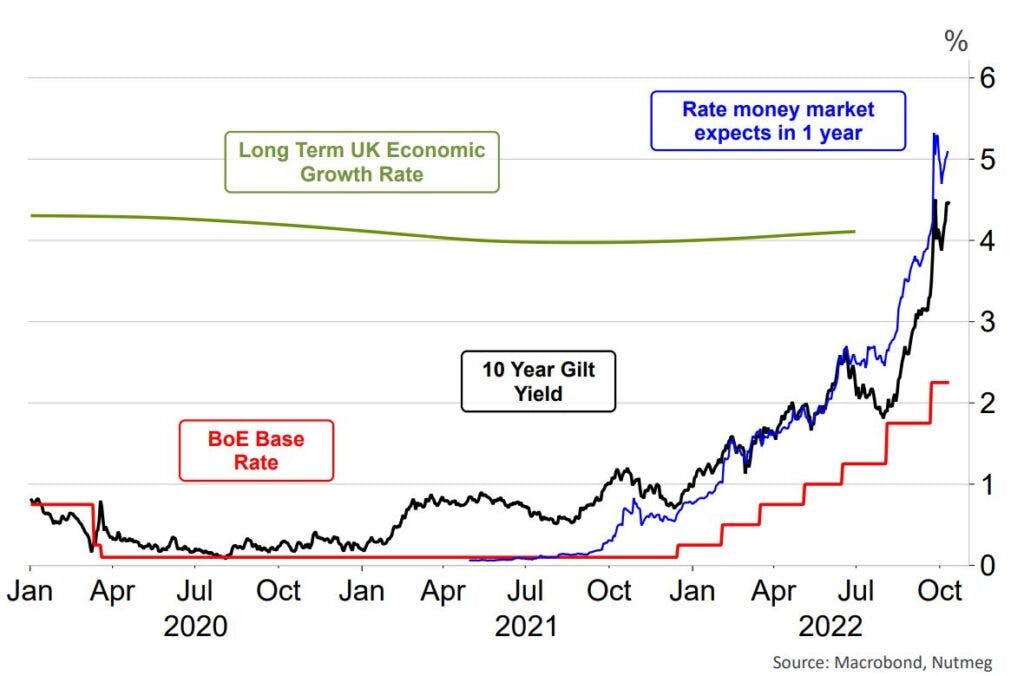
The 5% expectation for late 2023 shows how much more tightening the Bank of England is expected to carry out (the red line is expected to rise to the blue line). Markets may still come to believe rates can go higher beyond one year’s time, but since bond markets compete with cash markets for investors, yields need to be comparable on a risk-adjusted basis. US rates may also be an important influence on gilt yields, which brings us to Chart 6. This chart shows UK, US and German government bond yields in 2022.
Chart 6: Where will bond yields settle? The global view…
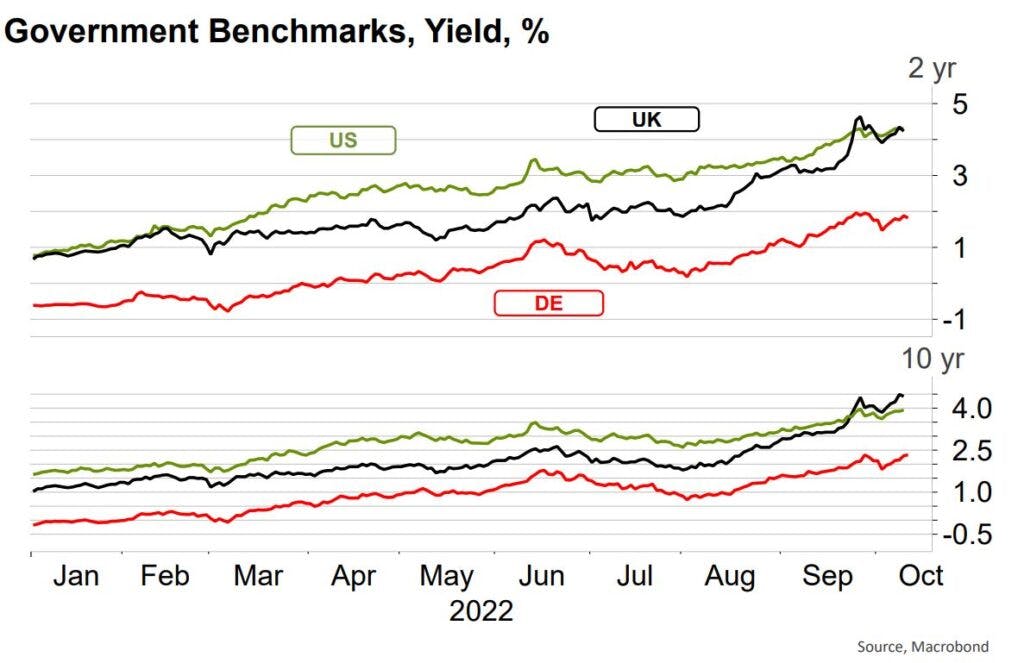
There is a clear global move in both short-term yields (the upper panel contains two-year maturity yields) and longer term (lower panel is 10-year maturity yields). While many in the UK press and political commentators seek to lay blame for UK bond market sell off at the feet of the new Conservative government, most of the move up in yields is global.
The Bank of England has intervened in the gilt market in recent weeks in order to improve liquidity conditions for defined-benefit-pension schemes, many of these funds have structured themselves to incorporate Liability-Driven-Investment (LDI) strategies.
These structures left these pension funds under-prepared for such a rapid rise in the Bank of England base rate. The Bank looks to be in control of this fallout and no major UK-centric move up in bond yields is expected as a result of this LDI-liquidity programme. As we have said, the rise in monetary policy expectations for 2023 has been the main driver of UK and global yields.
A silver lining for bond investors
There has been a sudden and sharp correction in bond yields. Analysis we have shown here suggests that yields need not move significantly higher; we certainly need not expect a repeat of 2022.
Investors need to remain aware of news and events impacting inflation, monetary and fiscal policy. But bonds as an asset class are again building a platform to provide a good yield (a fixed income), which will be reflected in the overall total returns of a portfolio.
Yields will likely move higher in coming months as the monetary policy normalisation process completes, but bonds retain their historical role in multi-asset portfolios as insurance against worse-than-expected economic outcomes.
Sadly, in 2022 bonds have not fulfilled that role as they are not then providing much income. Now, with a 4%-plus yield, bonds will again be able to play this role in dampening portfolio volatility, and this may ultimately lead to better total returns for portfolios.
Risk warning
As with all investing, your capital is at risk. The value of your portfolio with Nutmeg can go down as well as up and you may get back less than you invest. Past performance and forecasts are not reliable indicators of future performance.
