What do investors do during market volatility?

Brad Holland
30 November 20213 min

Journalists and media outlets often lead on stories around market volatility and warnings of falling share prices or turmoil for investors. While this news can be unsettling, it is often looked at without any broader context.
Upward and downward market movements are par for the course with investing, so here we look at typical responses to market volatility and how much attention investors should actually pay to the headlines.
While a 2% or 3% movement within a day in the stock market is of course significant, this type of drawdown would be expected two or three times per year when the markets react to global events.
Investor responses to market volatility often come under scrutiny, whether it’s an academic interest in the psychology of investing, or individuals curious about the decision-making of others when faced with stock market turbulence (should they stay or should they go?).
At Nutmeg, we have been investing on behalf of our clients since September 2012. We have looked at data on our clients’ responses to market volatility and it provides interesting insight.
As the chart below shows, there have been seven substantial moments of “above threshold” turbulence since 2012. These were: worries about Greek debt (June 2013); the Scottish Independence Referendum (September 2014); the China market bubble (September 2015); the 2018 market correction activity (February 2018 and October 2018); the US-China trade war (September 2019); and most recently the fears around the spread of Covid-19 (March 2020).
The flatter orange line on the chart represents the threshold (1.5 times the normal monthly volatility) to highlight slightly more unusual turbulence.
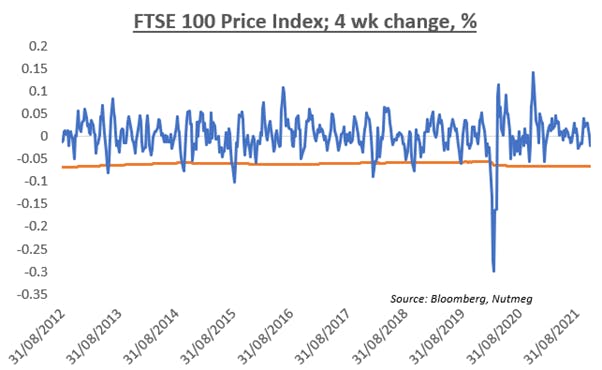
The average event involved an 11.2% FTSE 100 loss over a four-week period, with the largest four-week loss being -30% (March 2020) and the smallest 7.7% (November 2014). Overwhelmingly, investors with Nutmeg don’t make changes to their investment strategy over the next four weeks – on average 97.3% did nothing at out of the ordinary.
Of those that do act, around 2.7% of investors alter their portfolio risk level, with 0.9% of clients increasing their portfolio risk levels and 1.5% decreasing them. Only 0.3% of investors withdraw funds completely.
What about the pandemic?
The 30% four-week drawdown in 2020 was (as the chart shows) a stand-out event. Even in this case, 91.7% of our clients made no change to their portfolios. 0.8% of them made full withdrawals; 1.7% increased risk; while 5.7% reduced risk.
What do we learn about responses to market volatility?
The key message is that Nutmeg investors (and likely investors in general) behave in line with their own investment goals. They have already set themselves investment goals and agreed the level of risk that they are willing to take to achieve those goals over a given timeframe.
And when turbulence hits and the going gets tough, the vast majority of Nutmeg clients do not deviate from their plans. They accept, like most long-term investors, that volatility is a part of investing and keep their eye on the long-term goals they have set.
It is clear that our clients are really committed to their investments and their goals. This is evidence that the panic associated with equity market turbulence is largely driven by the negative headlines, not by investor behaviour.
Sources
- Nutmeg investor trend data: Analysis of anonymised Nutmeg client behaviour during the period September 2012 to November 2021. Data analysed the percentage of clients that increased their risk profile, decreased their risk profile, withdrew investments and those that took no action beyond normal monthly average withdrawal rates.
- Market events: Market performance data sourced from Bloomberg.
Risk warning
As with all investing, your capital is at risk. The value of your portfolio with Nutmeg can go down as well as up and you may get back less than you invest. Past performance is not a reliable indicator of future performance.